Understock and Overstock Explained
In one of my previous blogs, I explained that the biggest dilemma of retail inventory management is ‘to ship or not to ship’. Too much inventory leads to markdowns and unnecessary employment of capital and too little leads to lost sales and erosion of market share.
Since then, I have received several questions about how Overstocks and Understocks are measured. This blog answers those questions.
Right Level of Inventory
First, the right level of inventory is what you need for ‘proper visual display’ plus ‘what you can reasonably expect to sell (until the next delivery reaches the store)’. For most retailers, items on the floor are there to be sold (On Hand), and display stock is part of that. At times, though, merchandise needs separate display stock to fill a fixture for the merchandise to be noticed in the first place. This is what we refer to as Display Stock and it should be separately managed. For this example, we will assume that there is no separate display stock.
The right level of inventory is, therefore, ‘what you can reasonably expect to sell until the next delivery’. Simple, but not easy, because sales are unpredictable and more often than not, so is the lead-time between orders and deliveries.
‘The right level of inventory’ is, therefore, at best an estimate, or a zone, with a mean, and an upper and lower boundary, based on the deviations away from the mean.
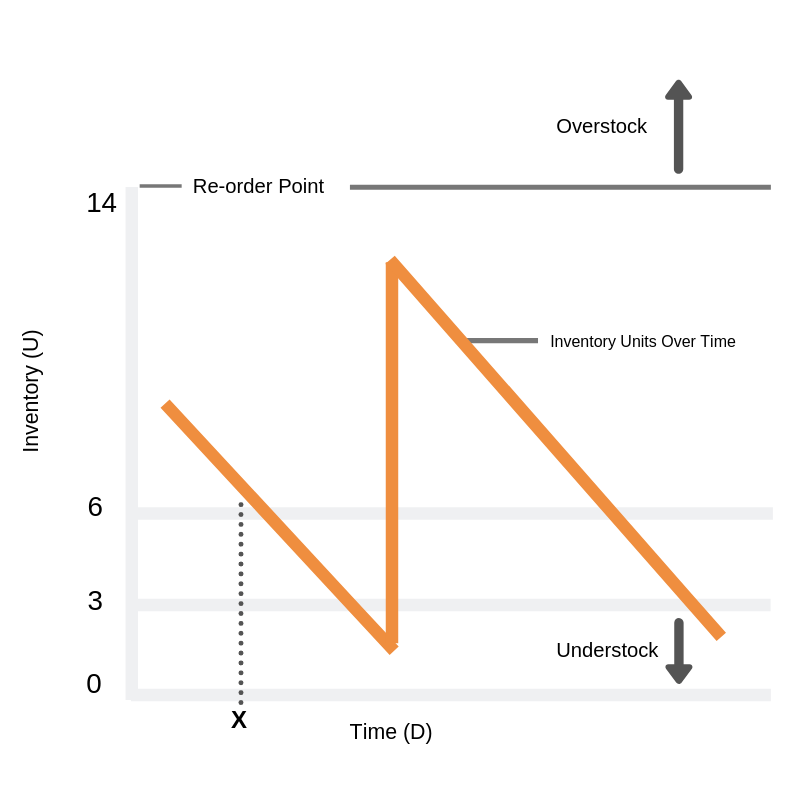
The graph shows a typical ‘sawtooth diagram’ for one SKU (stock keeping unit) showing how inventory (units) changes over time (days) when units are sold and ordered. This item sells very consistently (hence the straight orange line): after an order lead-time (OLT, to determine the reorder point) 7 units are ordered, produced (production lead-time, PLT), transported (transportation lead-time, TLT), and received in the store.
In this example, the ‘sales that can reasonably be expected’ hover between 3 and 6 units per week. The re-order point always needs to cater to sales, lead-time, and their respective volatility. It also needs to cater to other constraints like pack-sizes and minimum order quantities, but I will keep it simple. The shorter the lead-time, the lower the dependency on accurate re-order points.
Understock
We say that the business is Understocked when it is likely that demand cannot be fulfilled. This happens when the re-order point is too low, the lead-time is too long, or when sales are suddenly higher than what we ‘reasonably expected’. Fewer than 3 units would be called Understock in our language.
Overstock
On the graphic, point ‘X’ marks the time when orders are placed. At that time, the store ‘owns’ 7 (on hand) plus 7 (‘in transit’) = 14 units. This is also referred to as the ‘economic inventory’. Since orders are always placed up to the re-order point, any ‘economic inventory’ greater than what is ‘on hand’ plus what is ‘on the way’ (in transit or on order) is called ‘Overstock’. So any economic inventory greater than 14 is called Overstock.
Retailisation
We calculate ideal re-order points for large retail networks of well-known brands, mainly in the fashion- and sporting goods sectors. With a heavy dose of machine learning and AI, our software predicts sales and sends new re-order points to the ERP of our accounts or places orders on behalf of the retailer. All with the same mission: to reduce Overstocks and Understocks and maximize sales and profits in the last mile to retail in any channel.